You do really want to know, don't you? Not to disappoint you, we don't have the exact answer for this either.
You do really want to know, don't you? Not to disappoint you, we don't have the exact answer for this either.
However, let's perform some hypotheses on both Zalora and Lazada Malaysia, like what we have done earlier on the total transactions of Lelong.my.
Since these two online shopping sites are growing rapidly, it is important to take note that this small research of ours is being conducted in June 2013.
Hypothesis #1: "Word-of-Mouth"
Well, not really that WOM but local Rocket Internet team have been sharing key figures with their potential merchants or suppliers, as shown in table below:
| Sites | Daily UV | Monthly UV | Daily Orders # | Monthly Orders # |
| Zalora | - | - | 2,000 | 60,000 |
| Lazada | 60,000 | 1,800,000 | 700 | 21,000 |
This has got us thinking, as well as the main reason why we are writing this post.
Hypothesis #2: "PR figures"
As opposed to other local competitors, the Rocket Internet companies are quite open in revealing "PR figures" in press releases. Following is the compilation of their PRs since 2012, in chronological order.
The Star, June 2012:
Zalora receives more than 60,000 visits every day and have recorded monthly sales growth of 15%.
The Star, July 2012:
Lazada Malaysia is recording over 50,000 daily visits since it went live three months ago... Lazada Malaysia usually receives over 300 product orders every day...
The Edge, November 2012:
Lazada Malaysia currently attracts 50,000 to 100,000 visits per day...
The Edge, March 2013:
Zalora Malaysia has over 2,000,000 visitors every month and has recorded double-digit growth for monthly sales.
Focus Malaysia, June 2013:
Lazada.com.my receives an average of 32,087 unique visitors and 154,017 page views per day. Based on Hypestat's data and assuming a conversion rate of unique visitors at 2%, Lazada would be processing transactions from at least 640 unique visitors per day.Do take note that the figures from Focus Malaysia above are research done by the writer himself nevertheless it can be considered as "PR figure" too with consent from Lazada.
Business Times, June 2013:
Zalora, which started its business here a year ago, records more than 3,000,000 visitors on a monthly basis and recorded more than 100,000 customers last year.
From the same article, it is also interesting to note that Zalora Malaysia is the best performing country in this region: "Malaysia is its top revenue earner in the Asian market as it provides 30% of the overall group's revenue".
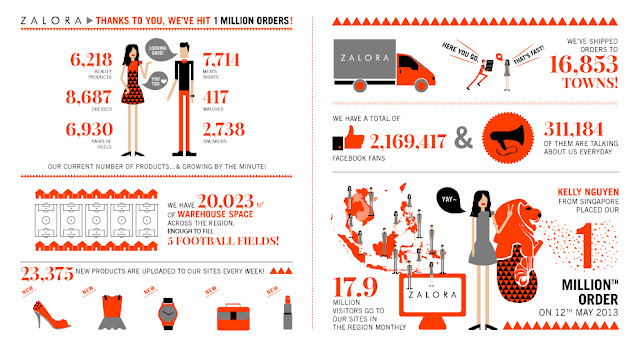
By referring to the Zalora infographic (image below) of reaching 1 million orders in May 2013, let's assume 300,000 (30%) of the orders are being made in Malaysian site. 300,000 being split evenly (note: it should be month-on-month rather than average in reality) for 12 months and it will be 25,000 orders a month.
By referring to the Zalora infographic (image below) of reaching 1 million orders in May 2013, let's assume 300,000 (30%) of the orders are being made in Malaysian site. 300,000 being split evenly (note: it should be month-on-month rather than average in reality) for 12 months and it will be 25,000 orders a month.
 |
| Zalora reaching 1 million order milestone regionally in May 2013 |
Hypothesis #3: "Scientific Research"
Perhaps the most accurate traffic & audience measurement free tools is Ad Planner (besides the paid Effective Measure & comScore), however (GDN) data is not available for both Zalora and Lazada.
Nevertheless, we can do a little bench-marking with other third party tools, unless some one is kind enough to share traffic data from Effective Measure or comScore.
| Sites | Alexa Rank (1) | Monthly UV | Monthly UV (SC) (2) |
| Mudah.my | 8 | 3.4M - 3.6M (3) | 1,950,480 |
| Lelong.com.my | 16 | 1.7M - 2.2M (3) | 1,950,480 |
| Lazada | 89 | 1.8M? (4) 960,000? (5) |
552,630 |
| Zalora | 118 | 3.0M? (6) | 663,390 |
(2) Retrieved from StatsCrop on 12 June 2013 (might have marginal discrepancy, serves as a reference)
(3) Retrieved from Ad Planner - (Region - Worldwide) UV within 10 May to 8 June 2013
(4) From Hypothesis #1, June 2013
(5) From Hypothesis #2, Focus Malaysia, June 2013
(6) From Hypothesis #3, Business Times, June 2013
By taking considerations on various data sources and that "PR figures will be stretched", it will be logical to make the following assumptions:
Lazada: 1M monthly UV.
Zalora: This will be a little tricky as Zalora is unlikely to have higher traffic than Lelong.my at the moment so 3M monthly UV is very stretched. Furthermore, Zalora is ranked lower than both Lelong.my and Lazada on Alexa (although it is just a reference). We will make our assumptions here that Zalora currently has 1.5M monthly UV.
Conclusion: What is the GMV of Zalora, Lazada?
As what we have done earlier on estimating Lelong.my's Gross Merchandise Value (GMV) a.k.a total sales transaction, let's apply the following formula:
GMV = Unique Visitors (UV) X Conversion Rate (CVR) x Average Order Volume (AOV)
We need to make further hypotheses on CVR, AOV of Zalora and Lazada by considering their brand presence and key products offering:
| Sites | Monthly UV | CVR | AOV | Monthly Orders # | Monthly GMV |
| Zalora | 1,500,000 | 2.0% | RM 100 RM 150 RM 200 |
30,000 | RM 3,000,000 RM 4,500,000 RM 6,000,000 |
| Lazada | 1,000,000 | 1.0% | RM 200 RM 250 |
10,000 | RM 2,000,000 RM 2,500,000 |
Update: We have a number of comments both on this page and via other means that RM 200 AOV for Zalora is quite high, so we updated the table above with more variations.
The monthly orders # quoted in Hypothesis #1 seems to double our assumptions in table above, for both Zalora and Lazada, coincidence?
Zalora presumably gets about 1,000 orders a day, is this good enough? Based on our intelligence, a certain local online fashion store is not far from this level with much, much lesser marketing fund. A David vs Goliath situation.
So, Lelong.my with RM 10M, Zalora with RM 3M~6M, Lazada with RM 2M~2.5M monthly total sales transactions, does it make sense for you?
Do share your thoughts!


COMMENTS